Tutorial: Comparing Conditions
A common use case for SPADE is comparing cell populations between experimental conditions (e.g., healthy vs. disease, pre vs. post treatment).
Strategy
- Fit SPADE on the combined dataset from all conditions
- Split cluster assignments by condition and compare population sizes
- Visualize differences on the tree
This ensures cells from different conditions are assigned to the same clusters, making comparison meaningful.
Example: Two conditions
import numpy as np
import pandas as pd
from densitree import SPADE

# Simulate two conditions with different rare population abundances
rng = np.random.default_rng(0)

# Shared populations
common_a = rng.normal(loc=[0, 0, 5, 3], scale=0.5, size=(2000, 4))
common_b = rng.normal(loc=[4, 4, 1, 6], scale=0.5, size=(2000, 4))

# Rare population: present in disease, nearly absent in healthy
rare_healthy = rng.normal(loc=[2, 8, 2, 2], scale=0.3, size=(20, 4))
rare_disease = rng.normal(loc=[2, 8, 2, 2], scale=0.3, size=(200, 4))

X_healthy = np.vstack([common_a, common_b, rare_healthy])
X_disease = np.vstack([common_a, common_b, rare_disease])

# Combine
X_combined = np.vstack([X_healthy, X_disease])
condition = np.array(
    ["healthy"] * len(X_healthy) + ["disease"] * len(X_disease)
)

print(f"Combined: {len(X_combined)} cells")
print(f"  Healthy: {(condition == 'healthy').sum()}")
print(f"  Disease: {(condition == 'disease').sum()}")
Fit SPADE on combined data
spade = SPADE(
    n_clusters=15,
    downsample_target=0.15,
    transform=None,  # data is already on a reasonable scale
    random_state=42,
)
spade.fit(X_combined)
Compare cluster composition
labels = spade.labels_

# Count cells per cluster per condition
comparison = []
for cluster_id in range(15):
    mask = labels == cluster_id
    n_healthy = ((condition == "healthy") & mask).sum()
    n_disease = ((condition == "disease") & mask).sum()
    total = mask.sum()

    # Fold change (disease / healthy), handling zeros
    if n_healthy > 0:
        fold_change = (n_disease / (condition == "disease").sum()) / \
                      (n_healthy / (condition == "healthy").sum())
    else:
        fold_change = float("inf")

    comparison.append({
        "cluster": cluster_id,
        "healthy": n_healthy,
        "disease": n_disease,
        "total": total,
        "fold_change": fold_change,
    })

df_comp = pd.DataFrame(comparison).set_index("cluster")
print(df_comp.sort_values("fold_change", ascending=False))
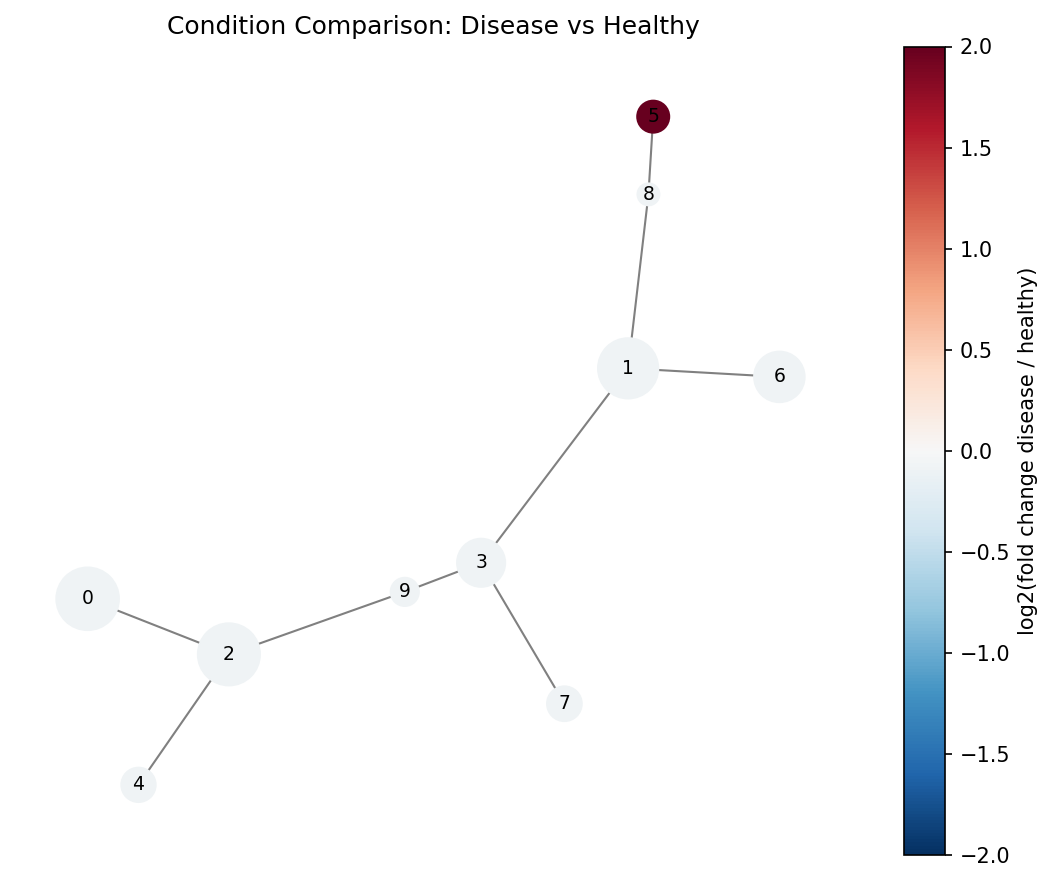
Visualize on the tree
import matplotlib.pyplot as plt
import matplotlib.cm as cm
import networkx as nx

tree = spade.result_.tree_
pos = nx.spring_layout(tree, seed=42, weight="weight")

# Color nodes by fold change
fold_changes = df_comp["fold_change"].values
# Cap infinite fold changes for visualization
fc_capped = np.clip(fold_changes, 0.1, 10)
log_fc = np.log2(fc_capped)

norm = plt.Normalize(vmin=-3, vmax=3)
colors = [cm.RdBu_r(norm(v)) for v in log_fc]
sizes = [tree.nodes[n].get("size", 1) for n in tree.nodes]
max_size = max(sizes) or 1
node_sizes = [s / max_size * 800 + 100 for s in sizes]

fig, ax = plt.subplots(figsize=(10, 8))
nx.draw_networkx(
    tree, pos=pos, ax=ax,
    node_size=node_sizes,
    node_color=colors,
    edge_color="gray",
    with_labels=True,
    font_size=8,
)

sm = cm.ScalarMappable(cmap=cm.RdBu_r, norm=norm)
sm.set_array([])
fig.colorbar(sm, ax=ax, label="log2(fold change disease/healthy)")
ax.set_title("SPADE Tree: Disease vs Healthy")
ax.axis("off")
fig.savefig("condition_comparison.png", dpi=150, bbox_inches="tight")
Blue nodes are enriched in healthy, red nodes in disease. The rare population cluster should appear as a bright red node.
Statistical testing (advanced)
For rigorous comparison with biological replicates, use a per-cluster test:
from scipy.stats import fisher_exact

for cluster_id in range(15):
    mask = labels == cluster_id
    n_h = ((condition == "healthy") & mask).sum()
    n_d = ((condition == "disease") & mask).sum()
    n_h_other = (condition == "healthy").sum() - n_h
    n_d_other = (condition == "disease").sum() - n_d

    table = [[n_h, n_d], [n_h_other, n_d_other]]
    odds_ratio, p_value = fisher_exact(table)

    if p_value < 0.05:
        direction = "enriched in disease" if odds_ratio < 1 else "enriched in healthy"
        print(f"Cluster {cluster_id}: p={p_value:.4f}, OR={odds_ratio:.2f} ({direction})")